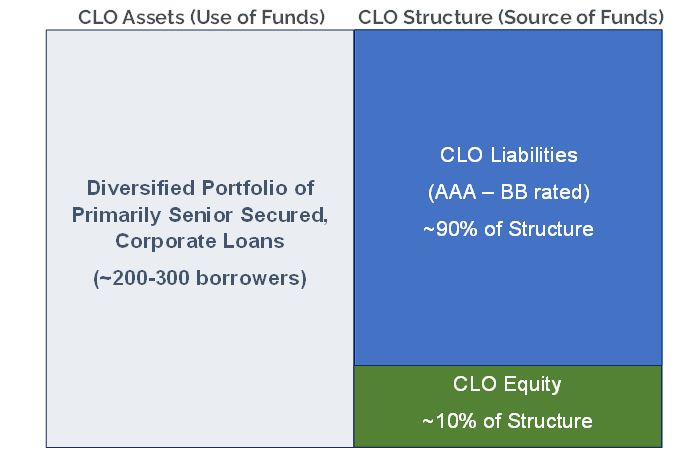
Why Leveraged Loans?
As the underlying collateral portfolio, corporate loans form the building blocks of CLOs. Leveraged loans are senior
to bonds and equity, having first claim on the assets of a corporation in the event of a bankruptcy or insolvency.
Representative Corporate Capital Structure
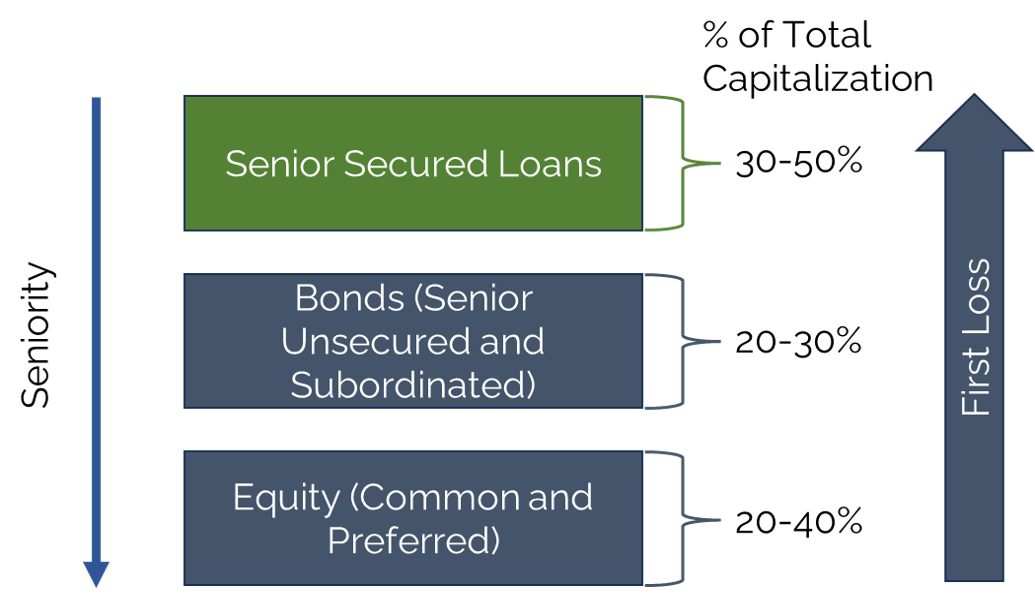
Typical loan characteristics and representative corporate capital structure are provided for
illustrative purposes only and is a generalization of the structure of the CLOs in which SPMC intends to
invest. The actual terms of any CLO in which SPMC invests may vary.
Loan Default Rate by Year
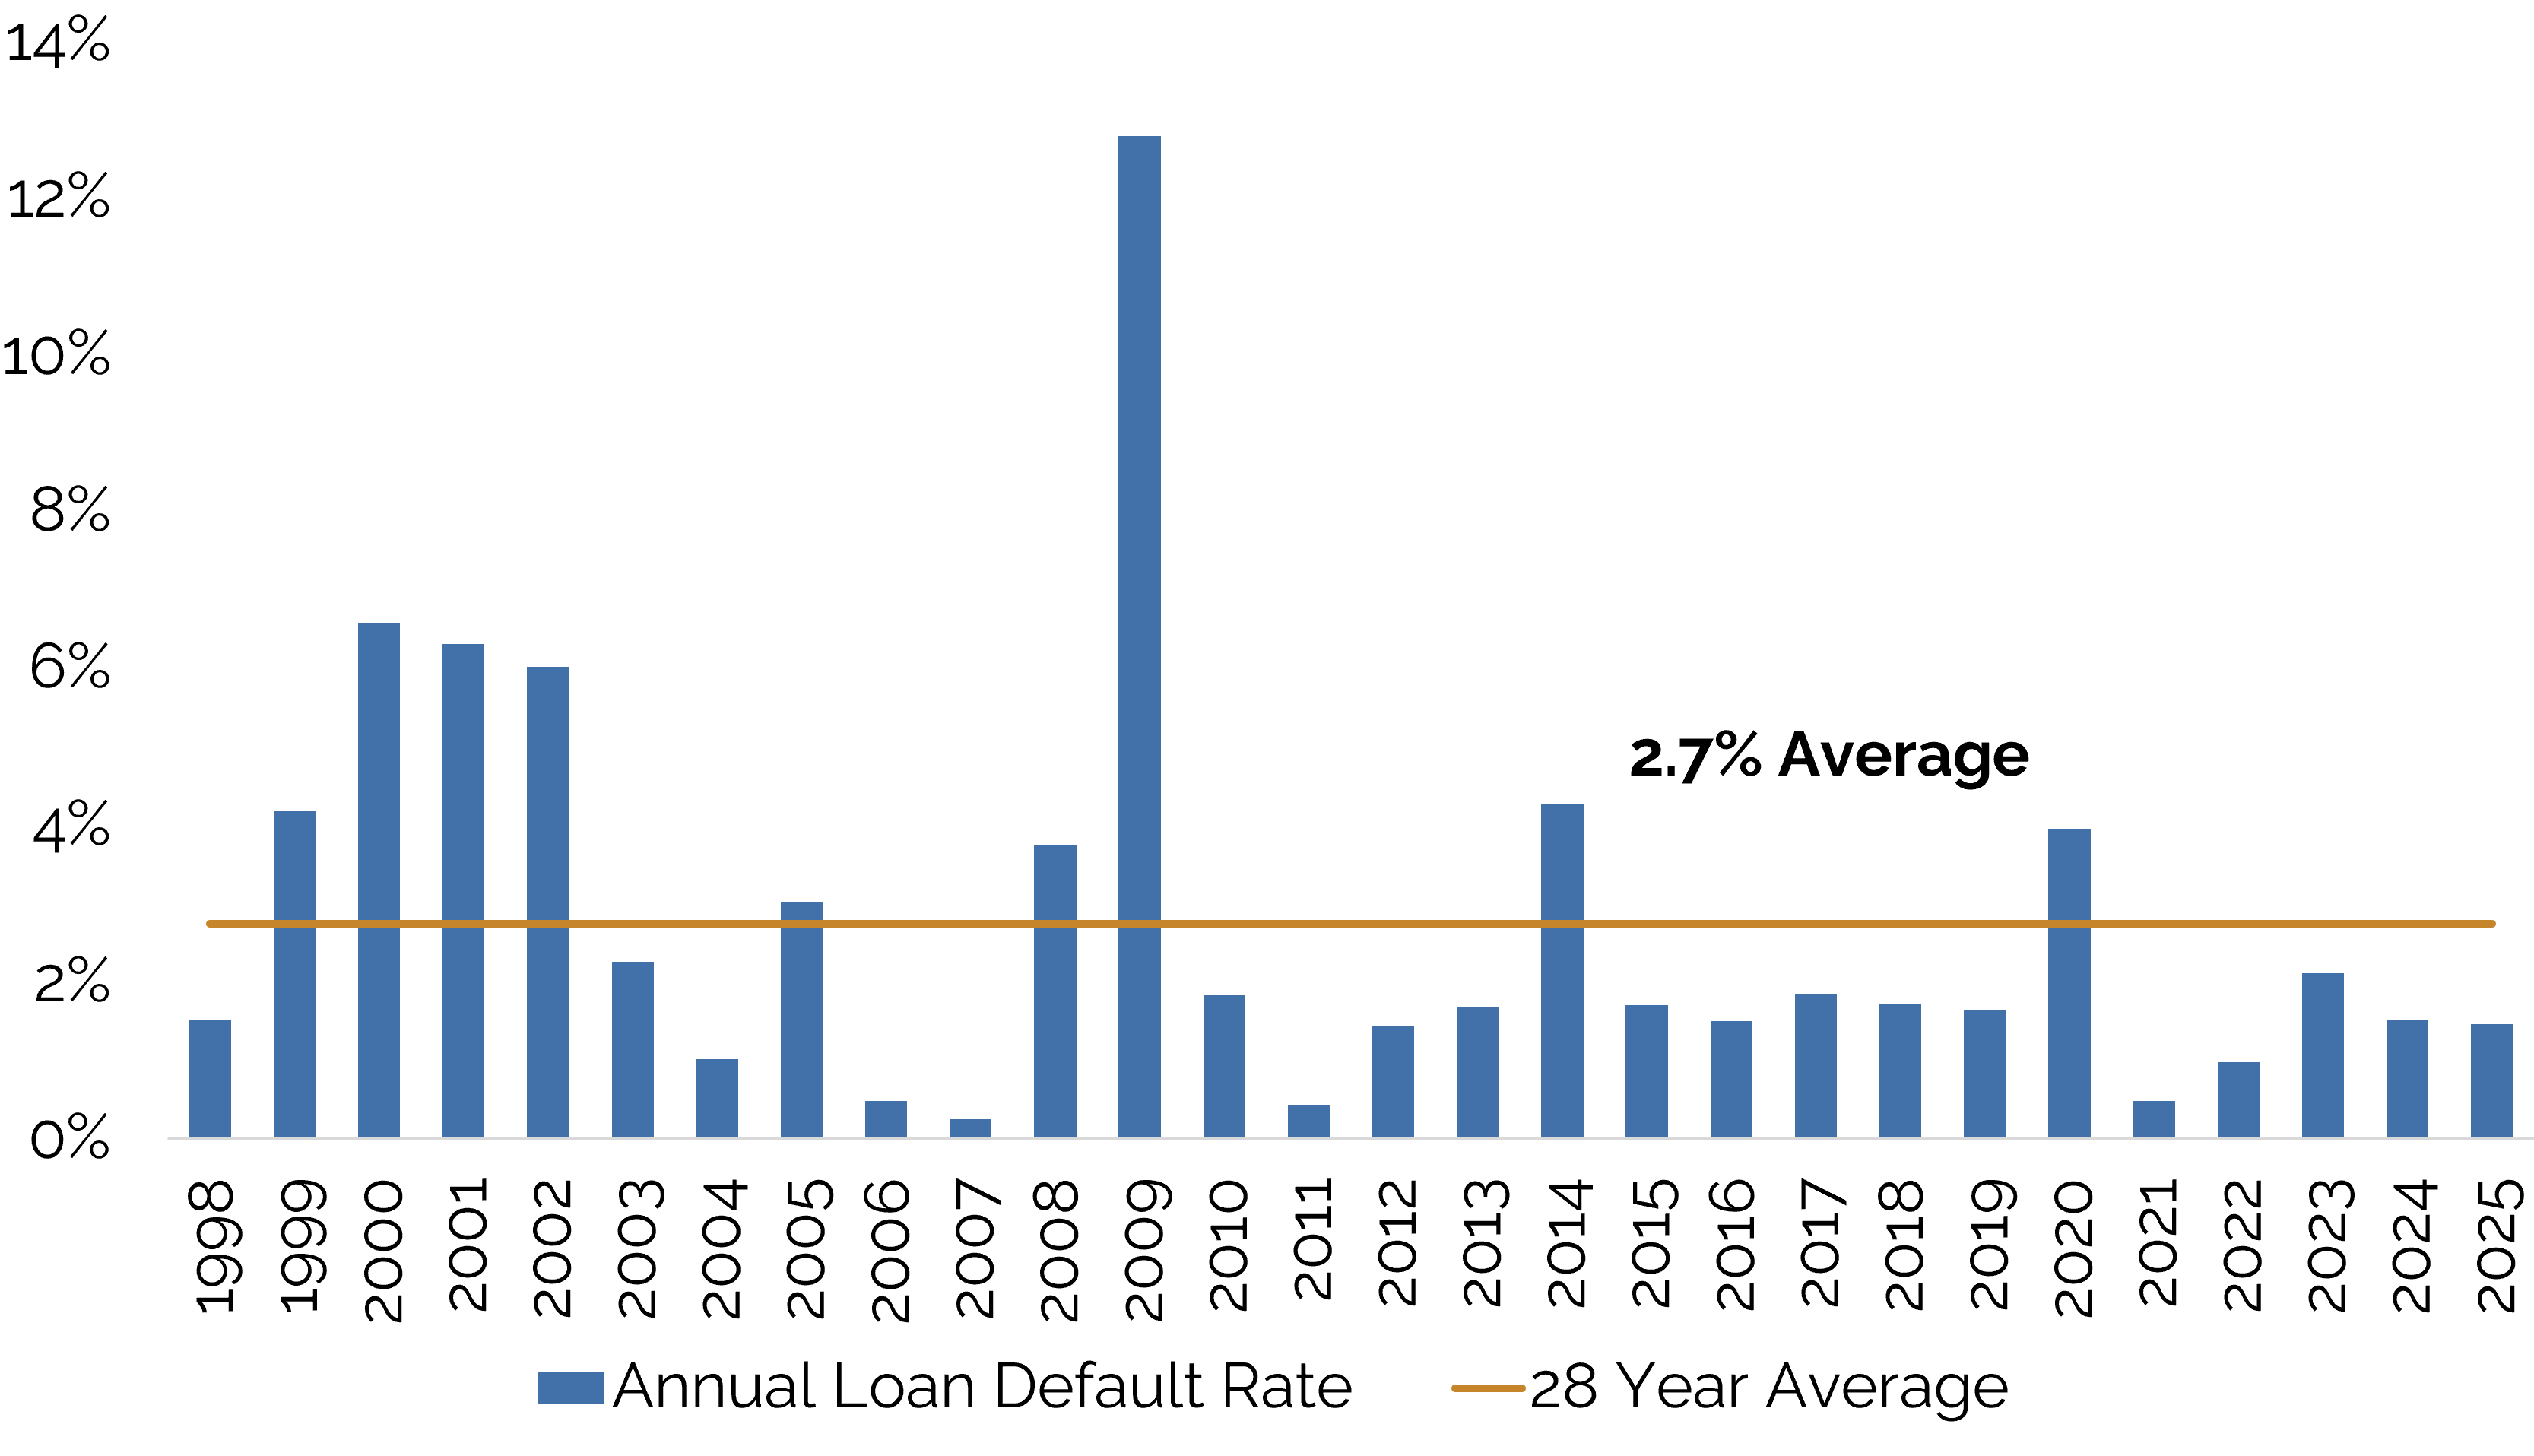
Source: J.P. Morgan Default Monitor; 1/5/2026.
Recovery Rate by Seniority
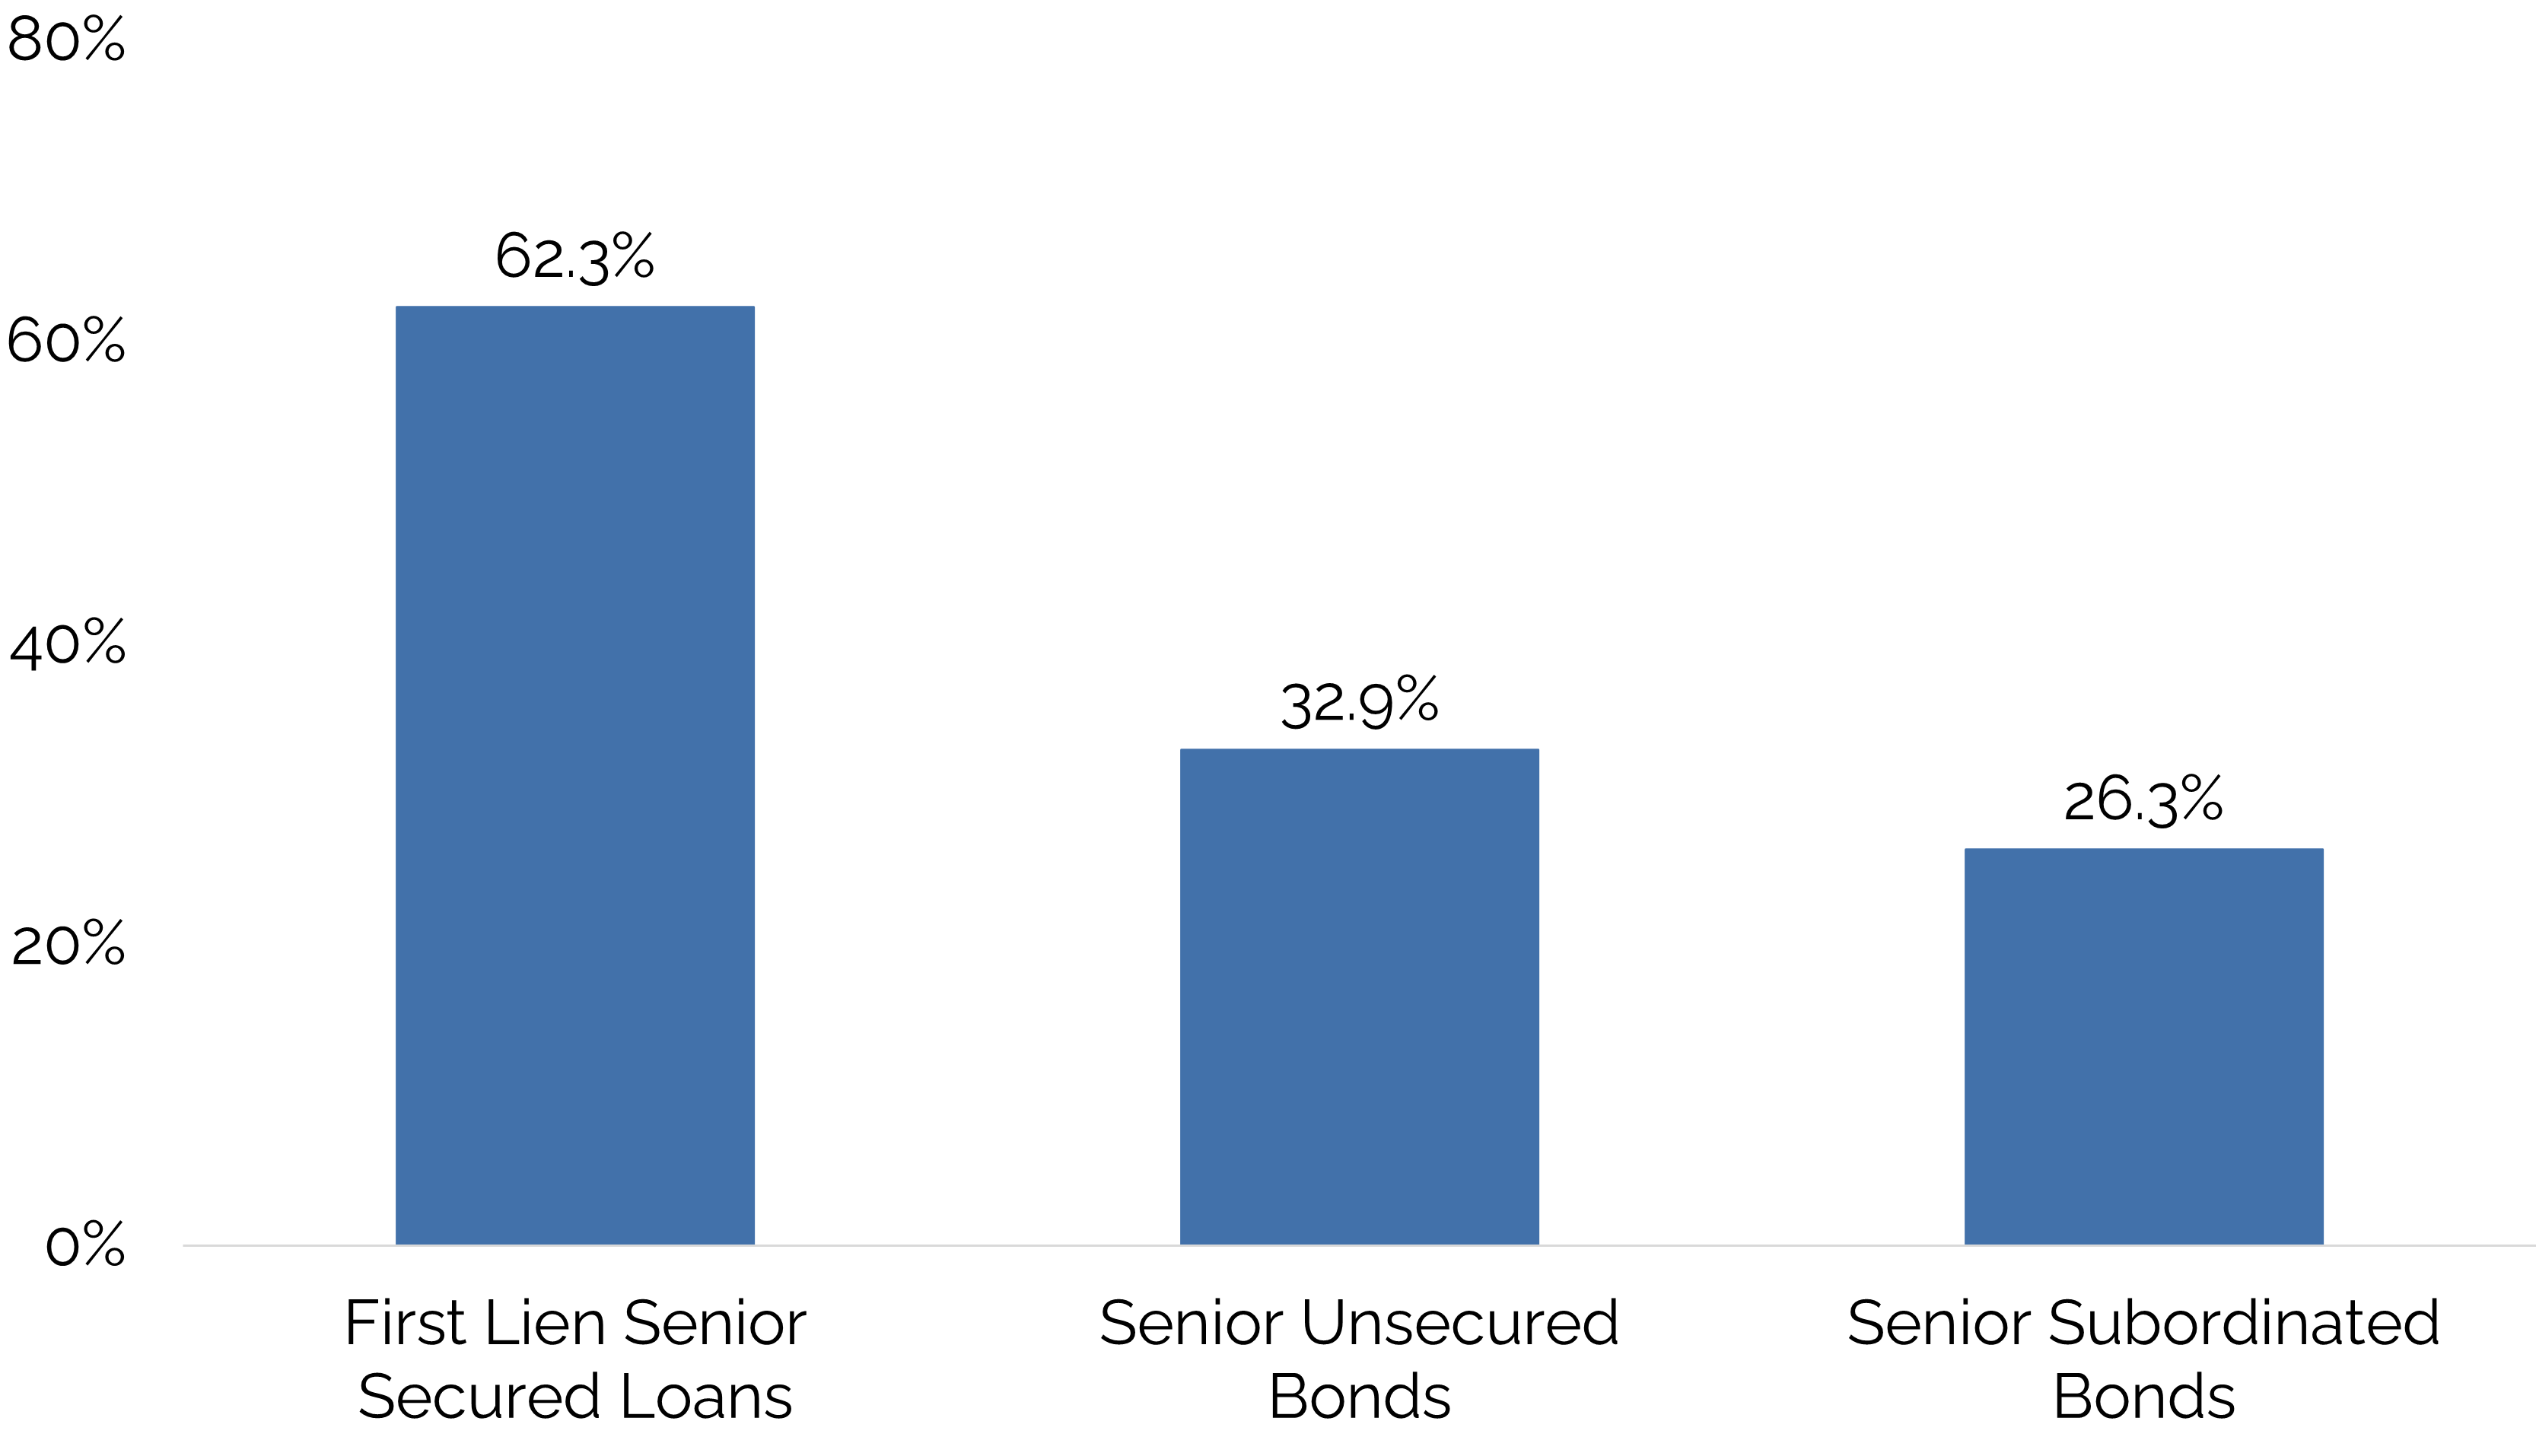
Source: J.P. Morgan Default Monitor; 1/5/2026. Recovery rates are issuer-weighted and based on price 30 days after default date. Data calculated as the 25-year annual average.
Leveraged loans have attracted increasing interest from retail and institutional investors over the past two decades,
resulting in a liquid and robust asset class. Both loans and CLOs are a trillion-dollar asset class. As the largest
buyer of senior secured, corporate loans, CLOs play an integral role in the market.
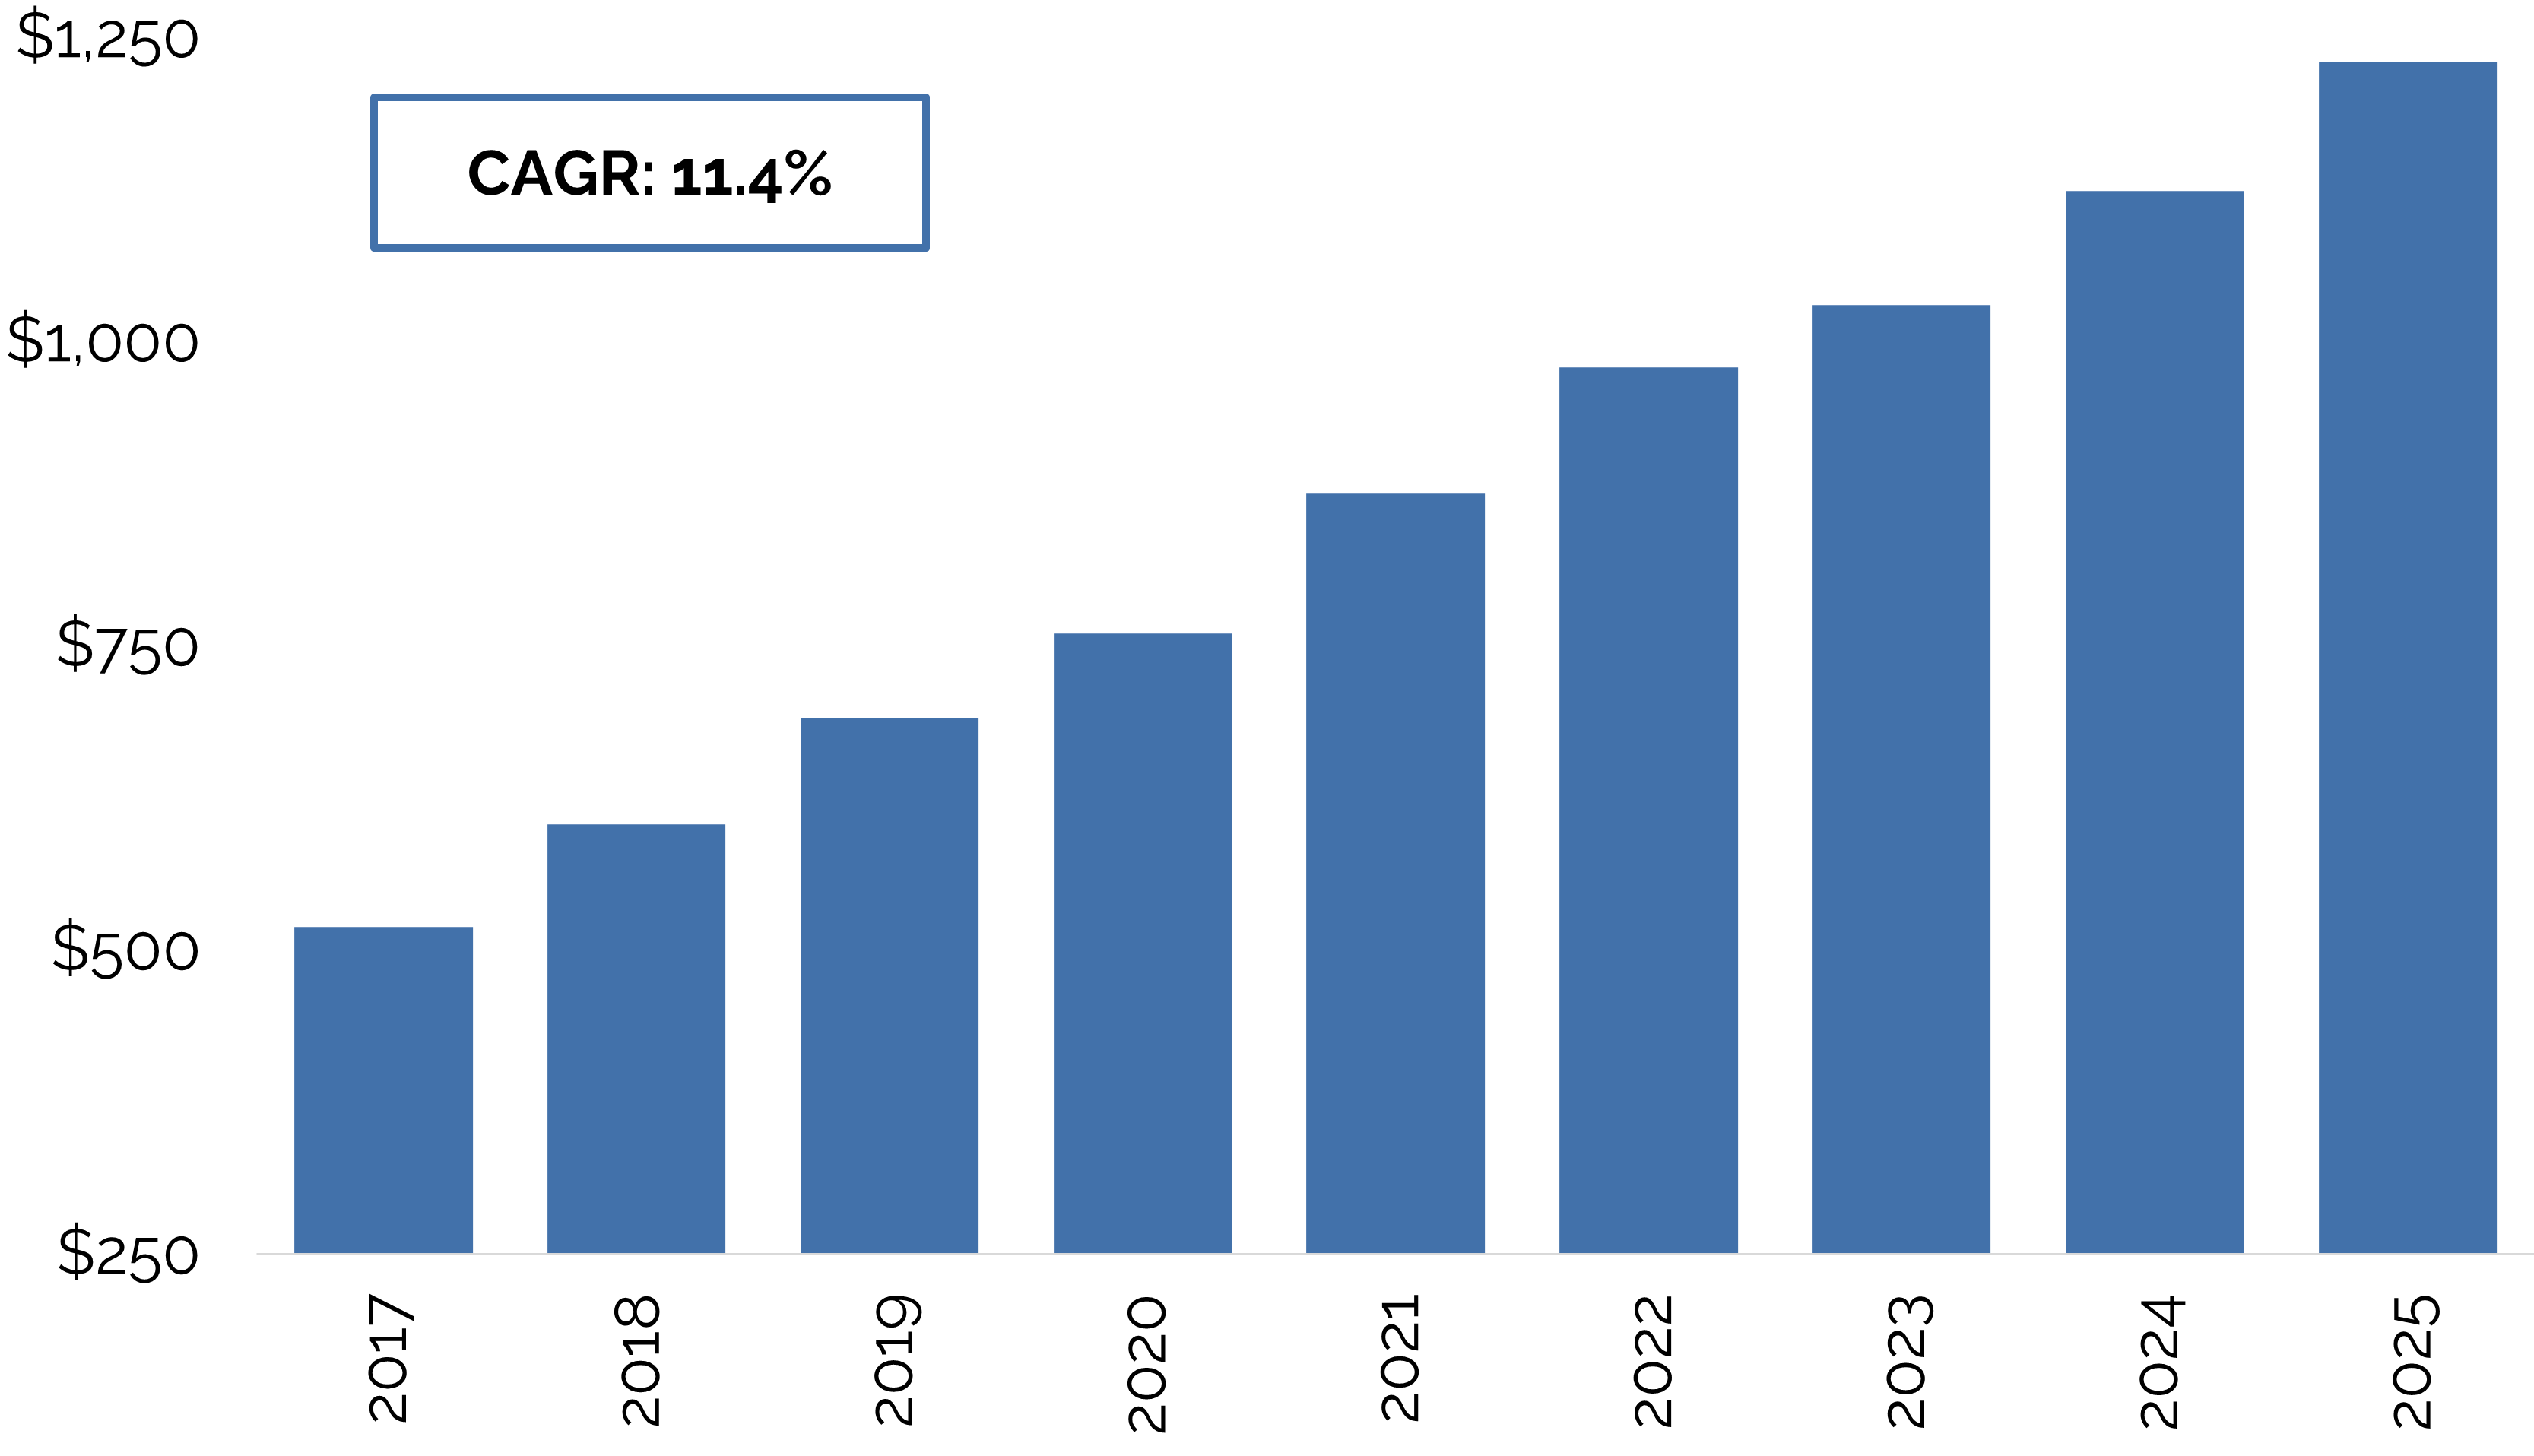
Growth of the Loan Market ($ Millions)
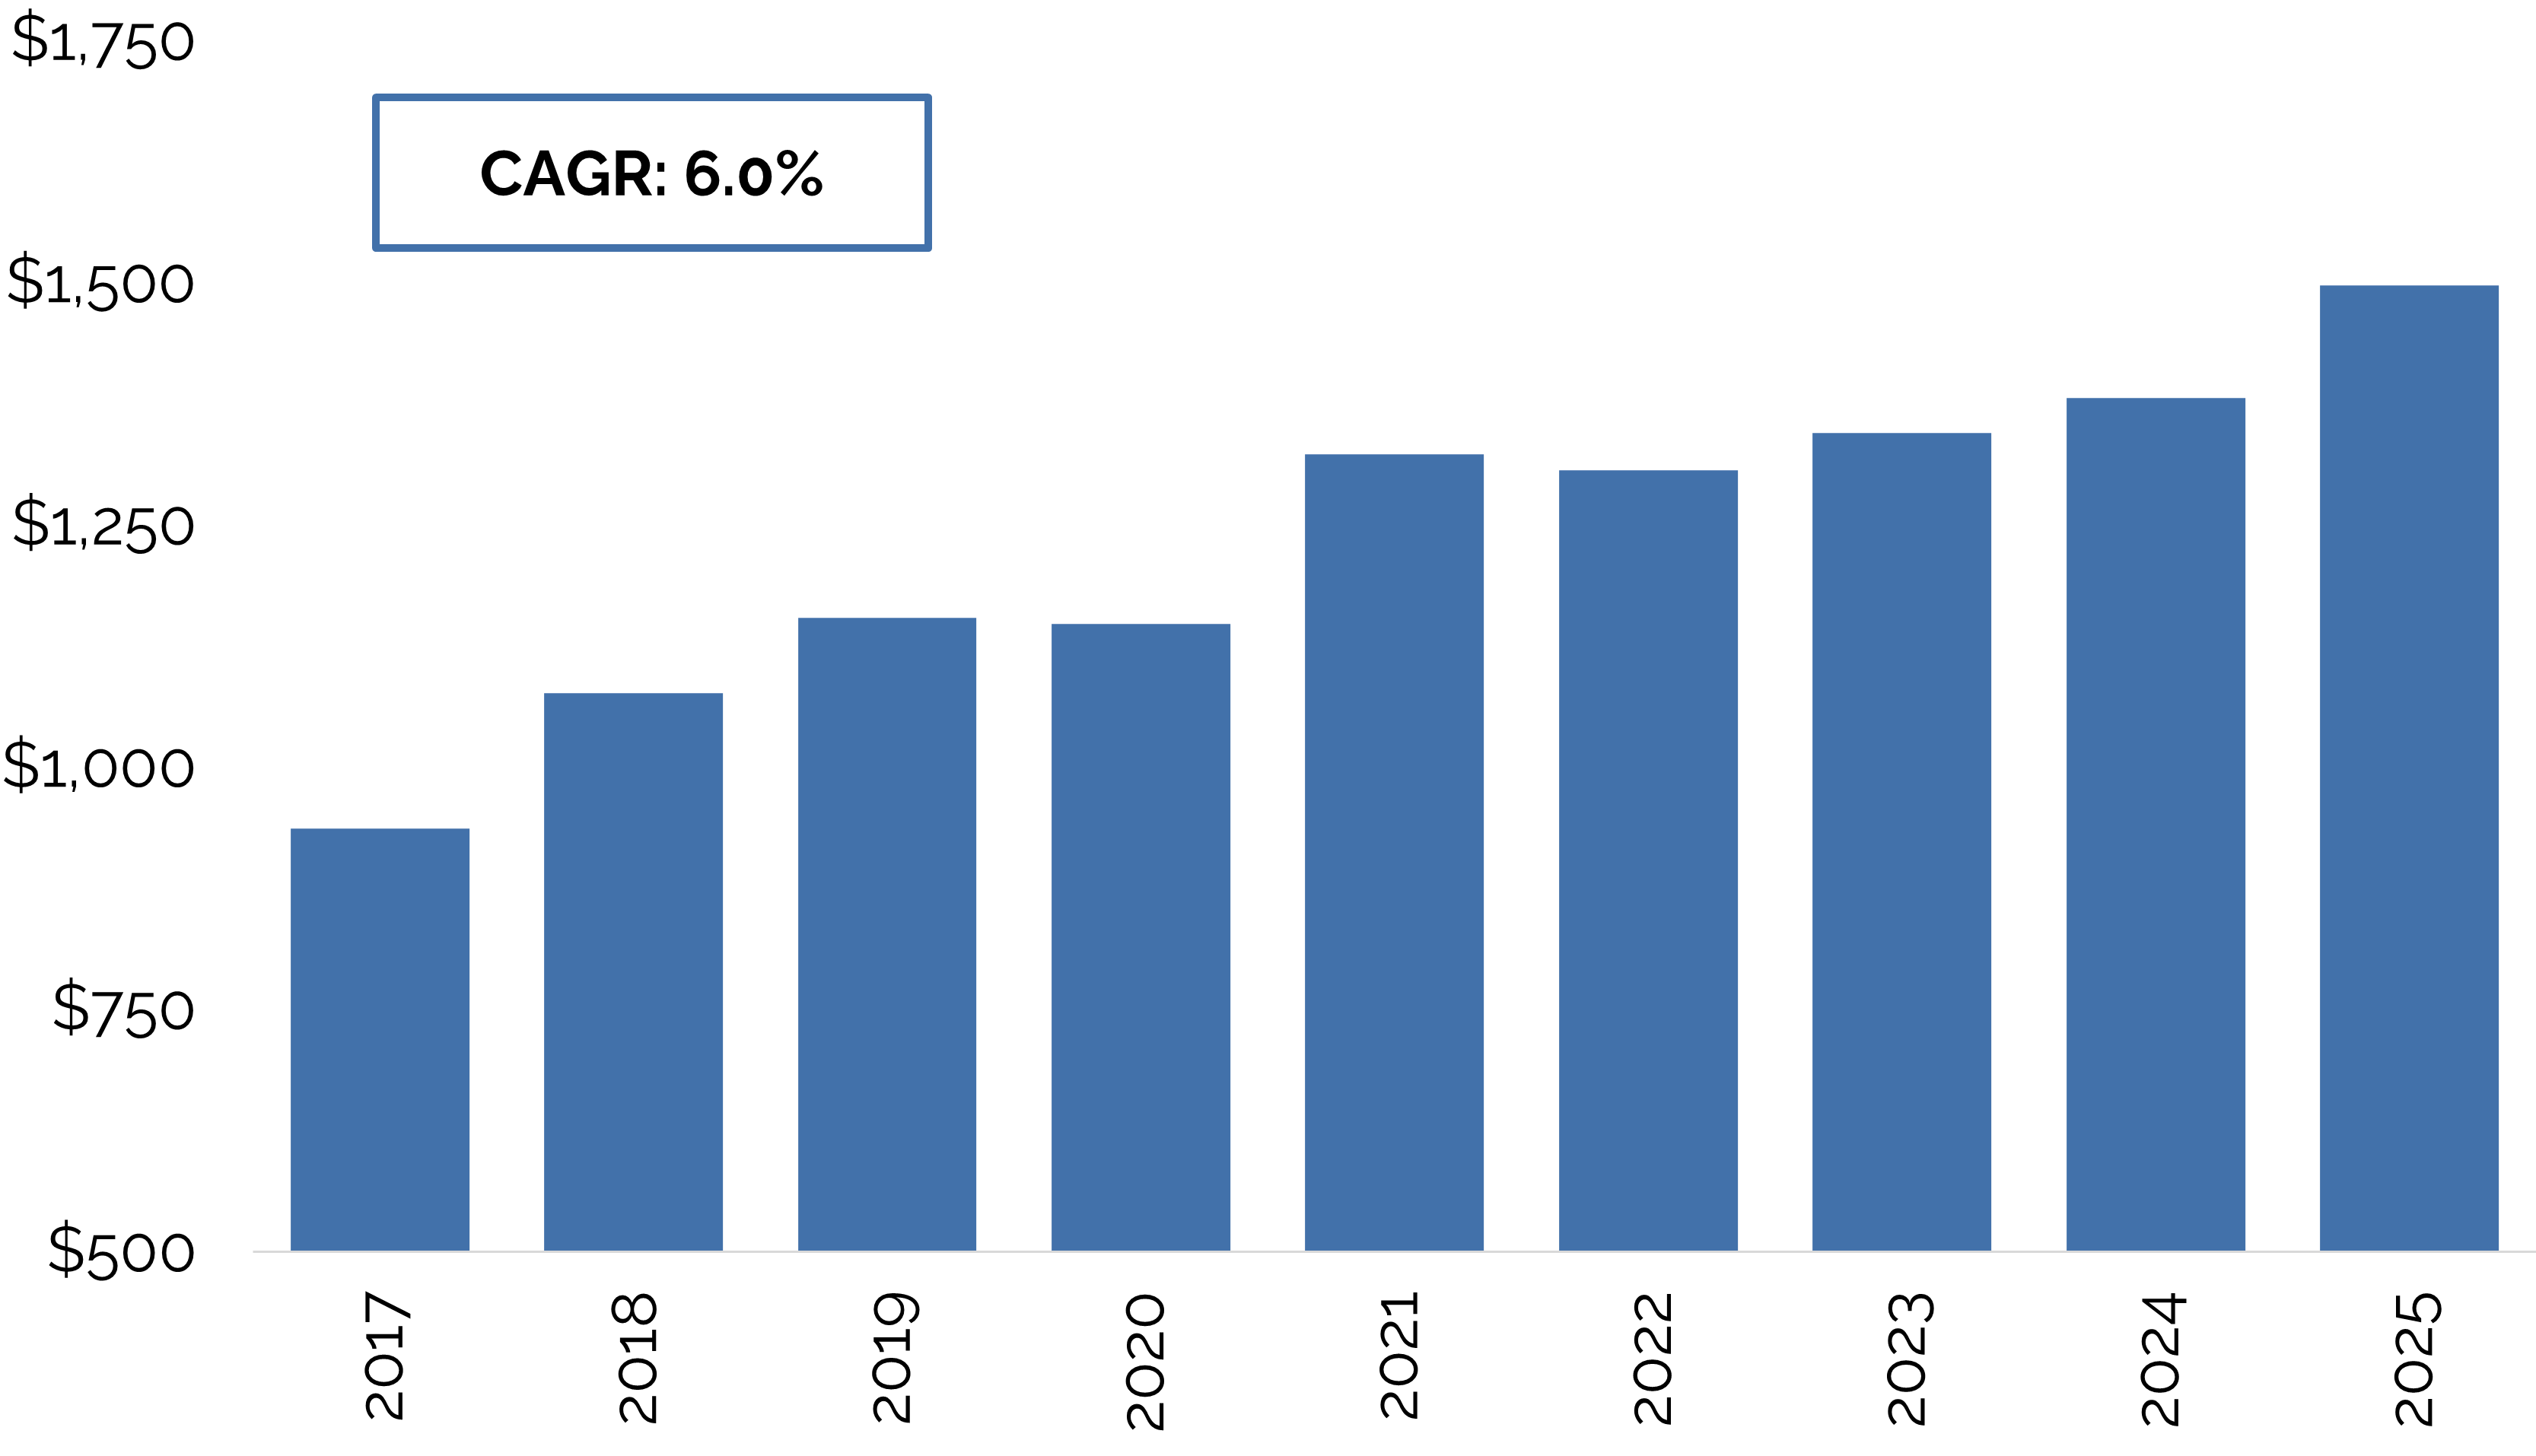
Source: PitchBook Data, Inc., Morningstar LSTA US Leveraged Loan TR USD, 12/31/2025.
Growth of CLOs ($ Millions)
Source: J.P. Morgan North American Credit Research: Securitized Products Weekly, 1/9/2026.
Institutional Demand for Leveraged Loans
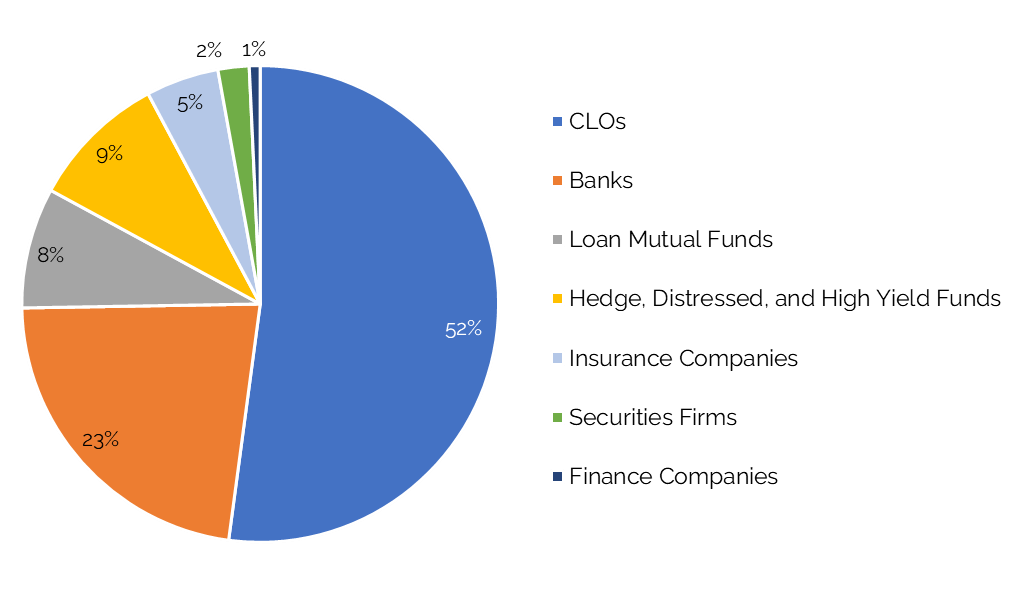
Source: PitchBook | LCD, December 31,2022.
Loans have generated positive total returns for 26 of the past 29 years.
Morningstar Leveraged Loan Index Performance Since Inception
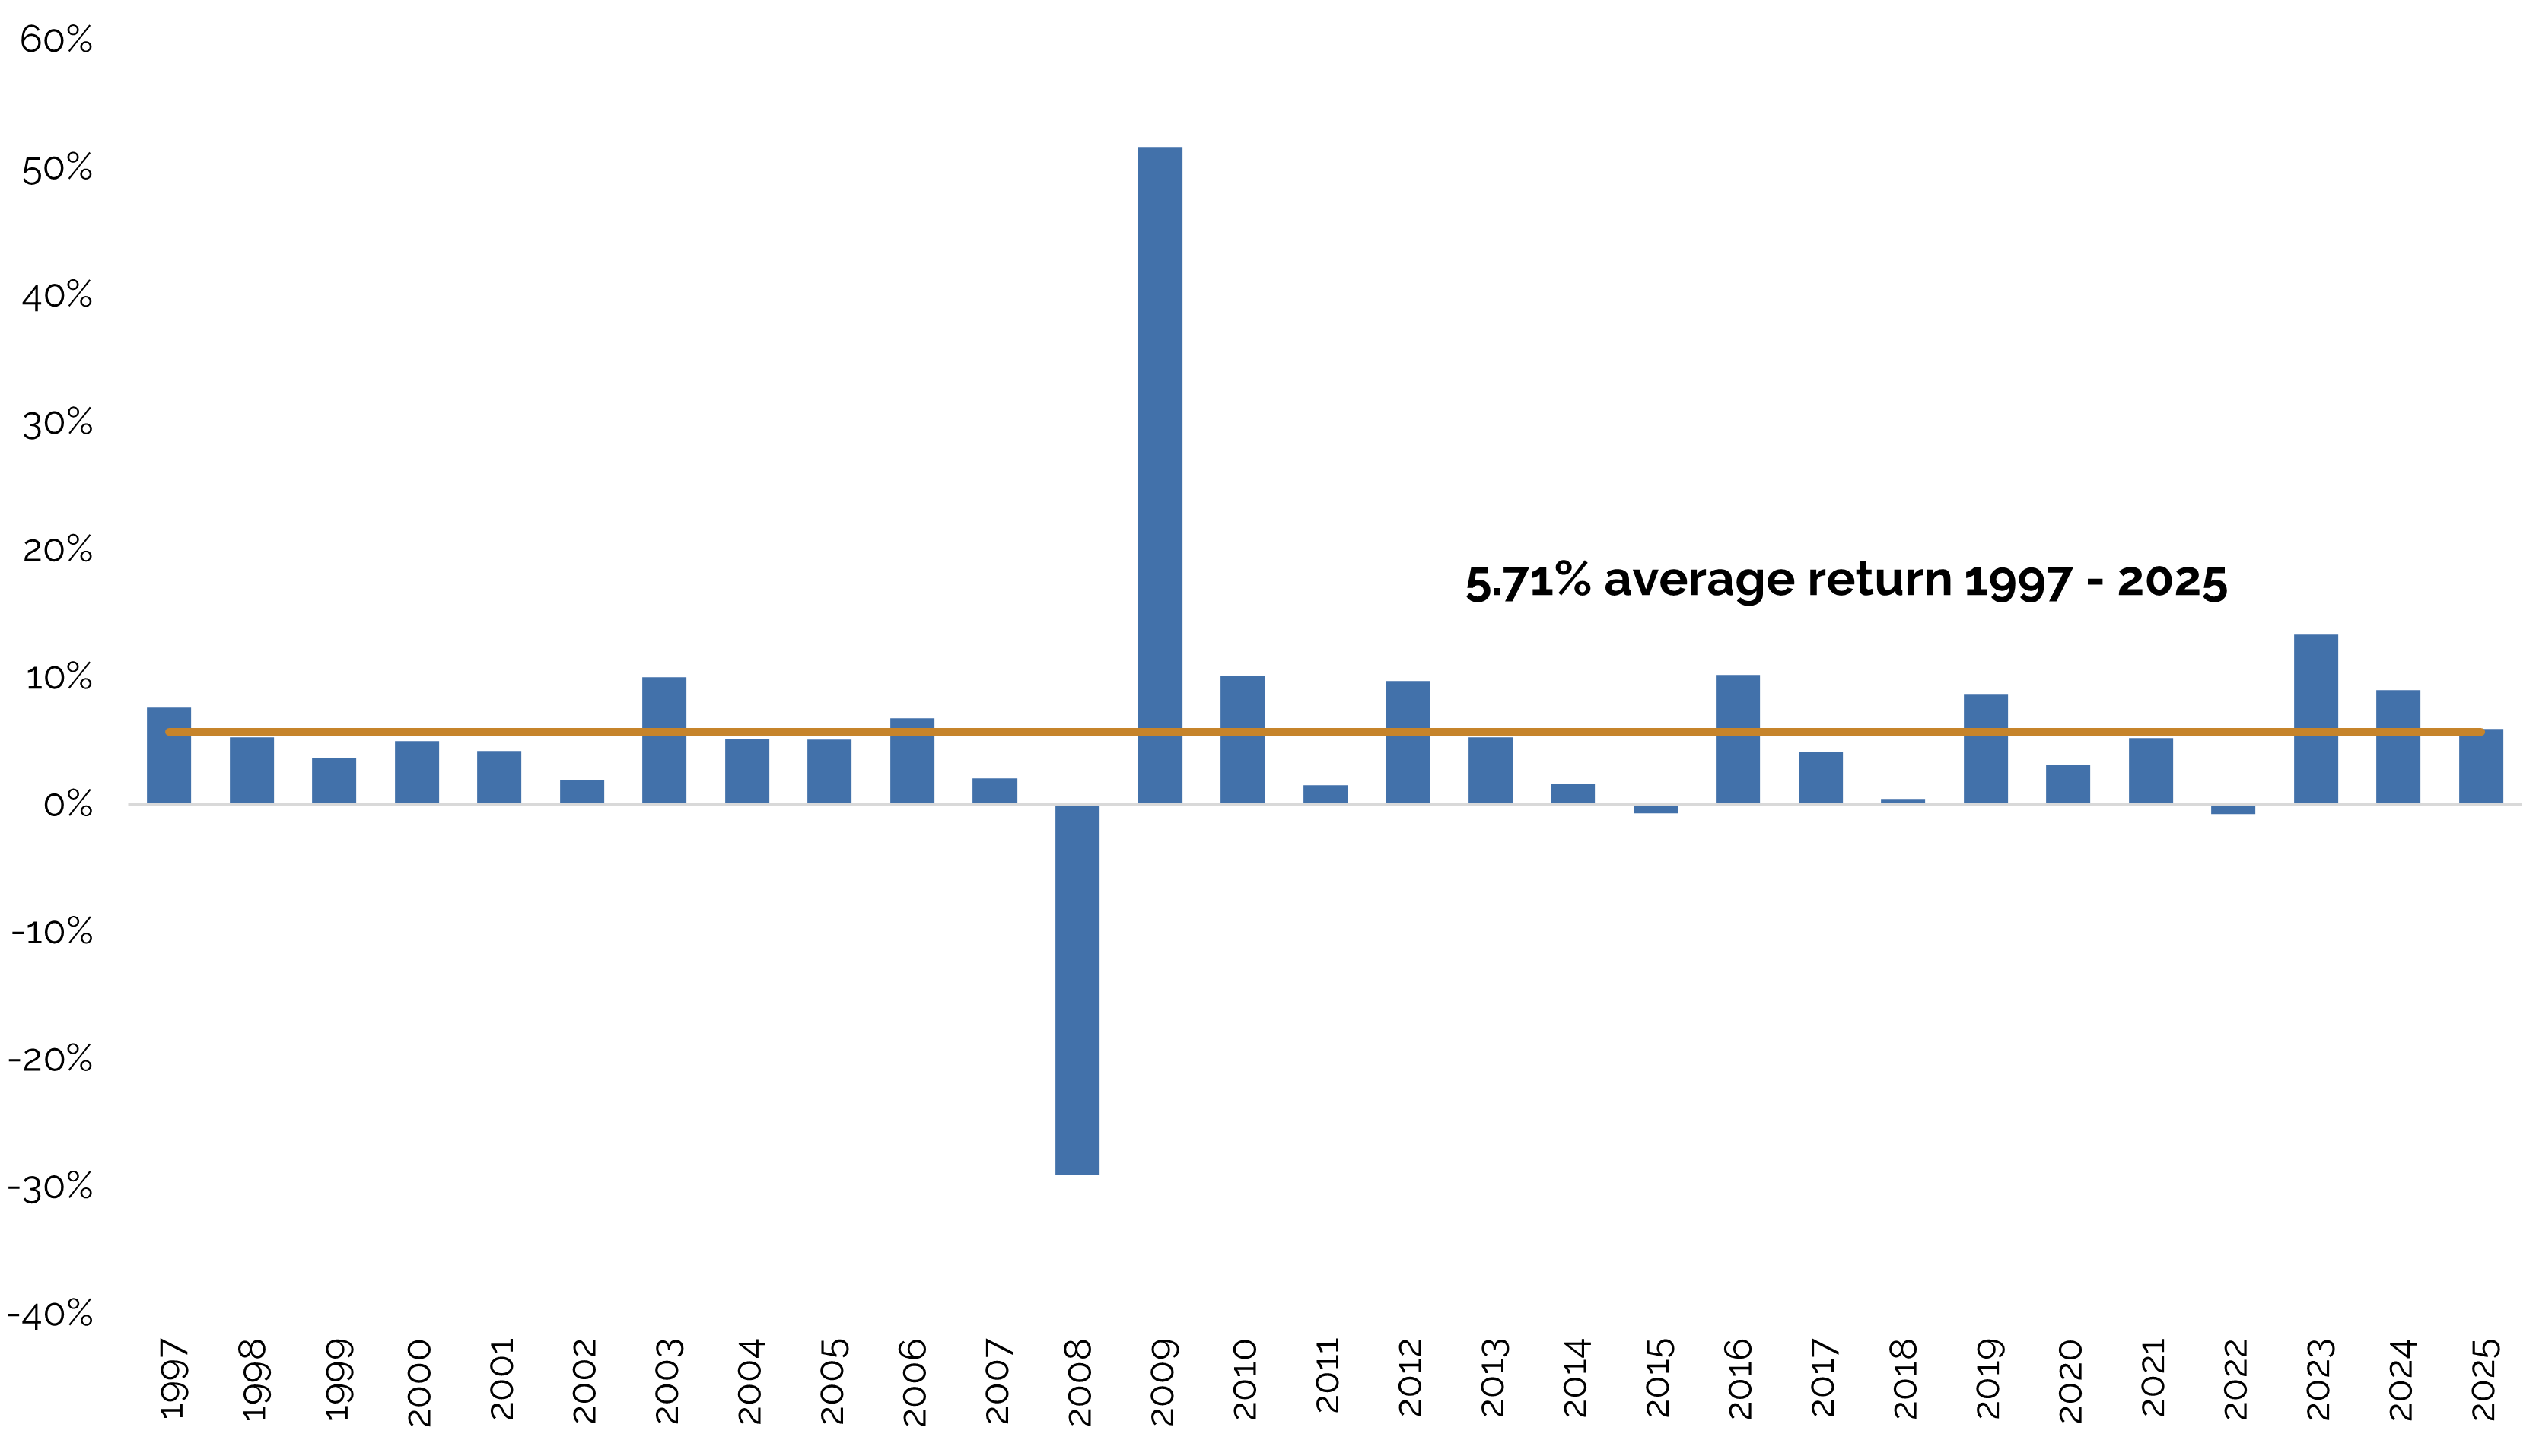
Source: PitchBook Data, Inc. The performance of the Morningstar LSTA Leveraged Loan Index (the
“MLLI”), is provided for illustrative purposes only. The MLLI is a market value-weighted index designed to
measure the performance of the U.S. leveraged loan market and is based upon weightings, spreads and interest
payments. The MLLI is unmanaged and does not reflect the impact of advisory fees. Investors cannot invest
directly in the MLLI. Please note that comparisons to the MLLI and other indices have limitations because
these indices have volatility and other material characteristics that may differ from the portfolios of
Sound Point’s CLO investments.
Why CLOs?
A CLO is a long-term, special purpose vehicle which funds the purchase of leveraged loans through issuance of CLO
debt and equity securities.
Structural benefits of CLOs typically include:
CLO equity has historically generated robust quarterly distributions and double-digit returns.
CLO Equity Historical Distribution % by Quarter (LHS) and CLO Equity Total Return
Performance, Value of $1 Invested (RHS)
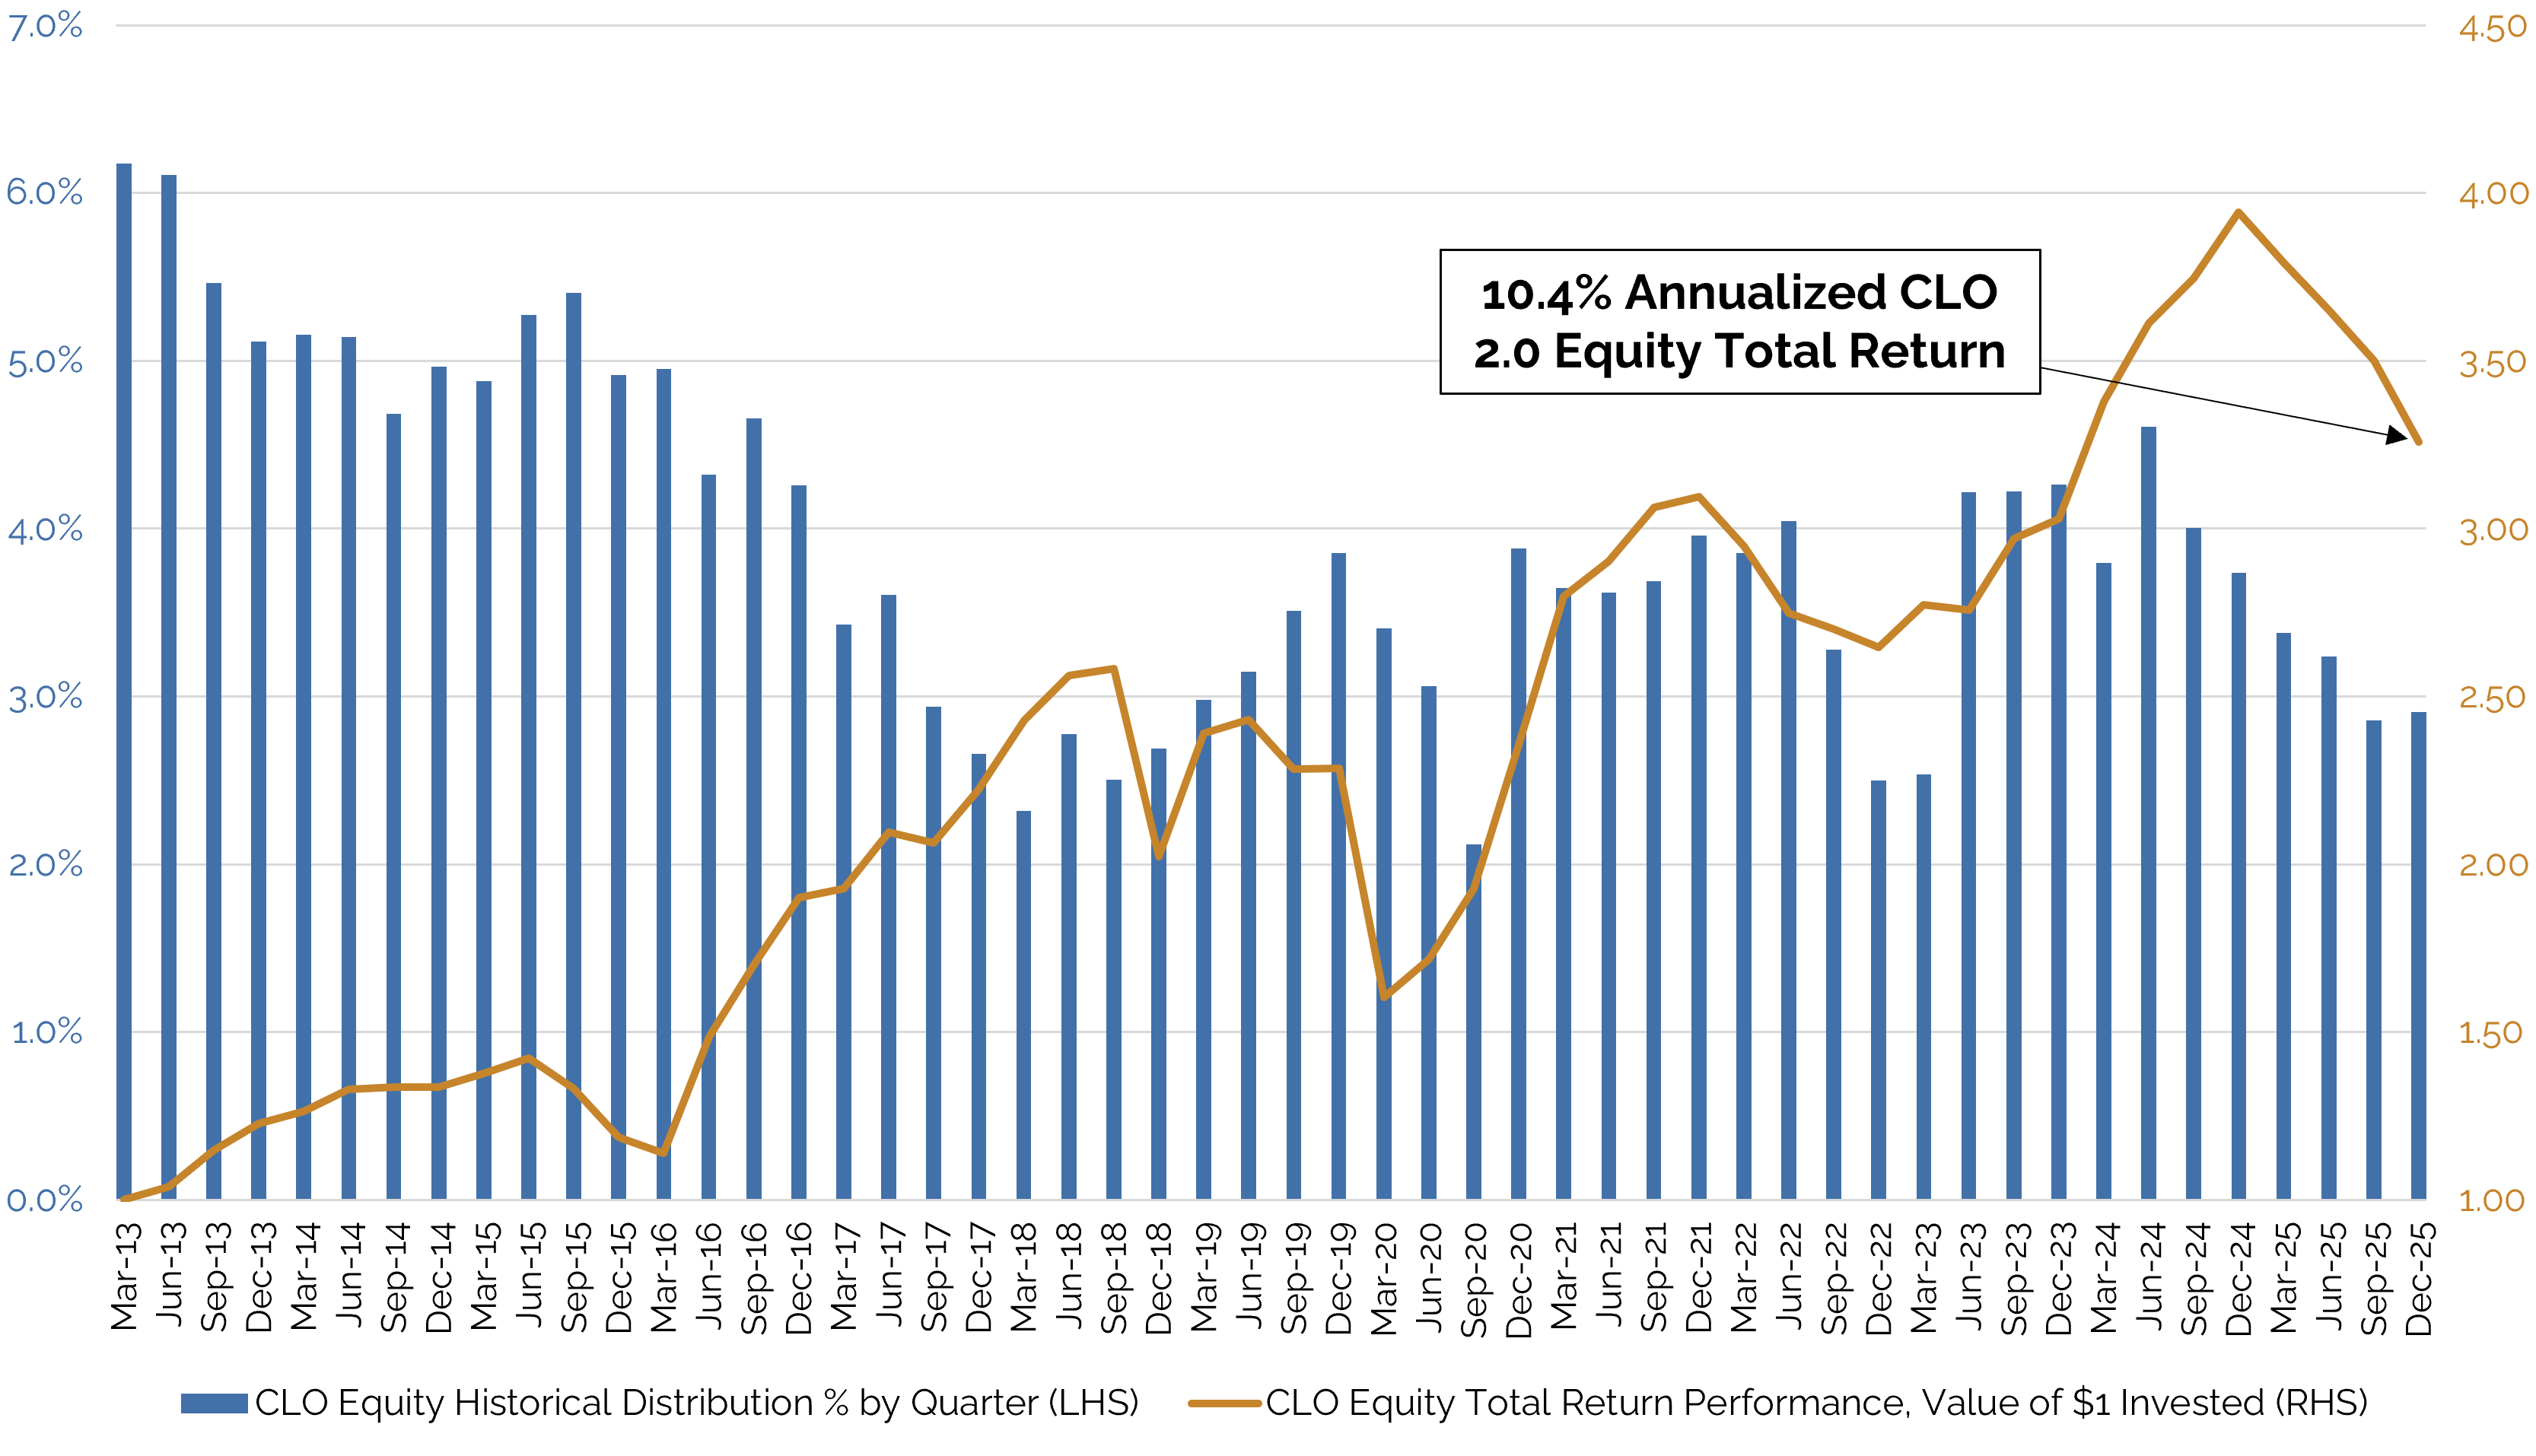
Sources: BofA Global Research, Intex. Citigroup Average CLO 2.0 Equity Total Return performance is published by Citigroup Research. Citigroup calculated actual CUSIP-level CLO equity total returns by month, using month-end prices from Citi’s trading desk, and took the average total return after excluding the outliers (top and bottom 5% percentile). CLO 2.0 is defined as CLOs issued from 2012 to 2025. Value of $1 invested and annualized total return are calculated using compounded monthly returns. Performance of the CLO Equity Index does not reflect fees and expenses incurred by investors in SPMC.